20328
U2FsdGVkX1+A3aqxI168MZPGX/T0CKlK8LWEqosra9K66LDqv0BGpHmhjX5hPDepoUPzzhZ1XKWl7MiPJYeWEaia6k967GwEfF2epoLSu/vd0iCF11hfQzLswW3ACLNBCMb7TqBl+NT8OP2GaRDaisodSmQBZhmlEthiDhnMFSFIU6RAngyelF9rQZg2+nghP7aAUqROSv1YhXFRoq8ipfFdhcv6qTlc0xUj9apCCpYTpqLQW9BgSg2b9zHLZC7d+7RwzbCoDSU9aTS7VqvbLzmVV8S48HxBXnnEwt78XL2zIH1qbeHp+/C9vrHH2wk/glMuldDhufnQBxMRNkZ1bmz+kHR325yR4H/ivVoaknkLDgv2EHP9gf48aaUPfa5r7na4arl9UkzuqHXO6lqygPWyy0+G6qymK3TpnNAryNofGU5mjd0+Lekh1FIAomzvRe2gZJ/VFqpJbaEITqJ5CXb8Zm5dd1XIL6lDfgk8wPgWFZGLpr0bfow1hsflWBgpviTGTUQ5IhcvPhyZBv6C2BwS8vcc5XfixcUm1NRJOe6wNxQkYn/Hox63G62DmVasnhgzjO6bYqLlAGhQrW16f7qzIlFzaL4NmLsHeEVO7yHJtrEHqZT4PtJiX2GhSXAjrttyCuLzHXyLgX8nY/07KYVtvEFiIxRCXfzO2zKr3WcOReb//1lDGzT8ibIdHQ6helbIP5r0kXHfYIMsv4fvBRBTHplffRFfjZF9RoDIJtssM9IVq5g4nj8qH8y1iPJl5KeznM5LV36nweq1I+BVCT/FDaM9NOsZDq6wGBOi5br7lFWtRNvtVgOO1IuRe8sN+Iu90JUblHj0DDVMJBsWrW9kqHn7G/+jaIbTPURKZPwfjeDr1Sz6Vxrqmeh3nt/MYvcNfUv8BO92ILWHiLLOrub1wxARrpLKbQ5ywAoqwlioJGlvyMwRvDT9zzl3O2pq2FPuhuFJ+kziNgIo7N9Uu/pcM5qtaCqE3JoYkLYS+5bjAE51+wu6QNMXGuJtNwXJ3p0H8pmHTfkkuf1OPOFTE36TShM9kuIl4CdimakGKBkfwa1+Wzc2w3jEj/TRXgDy5MOL+SxybMHFVIDgMmf9r4HsW2urpsBFcJsAKHs64rXXrcvLzVr680Zuo2bw1LSc3q13/y4otFfMFtlAAx1foaS3W5v1iy5Pz2PhTVEIddW5EQKSFf5YLCsx/uhKtilrz0I8j48Ly/cNMEl8C/Ac8iFxRIZ3PPsgaq3QVtFs5ZTdAe5peAP28Toy9gC26PDWjGPLfHicdCrwXg3HvDBGB+elPYw+Q9qdEqnAJQOzDE9r7I/UKzUs7HfEPSCtRpR73JvVbh1s0fSE75snxTBaPfjABBsi/1pDzotxUtycA3CY1seQRwKOsAtEyAt3UBrGUNAtsZZjTOYax4BWOwKDfXnyfdyzdFXKRE7jFaUUrcnMM9d+mqLCBEpH7hIG54Yw7u2o35OY7TgVTr8EzANotJdDVJ5No1XykOIDvLmpGEfcFqbopNKnnST6dJymmnbHIHLt6aL7zURP1ml5JkMzX1+RpR38Eqgw+KoNuzMUssmMFpI0TErerDANnJFC47sp6dACWIHbUghHhHHFMYv+L22lYJBU/86zGM3BH4HgS21FOqnPbIVlozb5OG7rPgohwcJzaXmfXI9e0UUurMn0ENQErA7c8ON/01qpVIS79MWjTBD3NRvZwZxkEfMynHLPjmefeY2uvqgO/wANED3HQk3KSfvCYYpFQ7+YSwslGMgy03BD0uAaxW5a01n4pvO01OMfSUEXKiUqzDl5A3IP0Dga8VnWoNfz/mU6q8CFO4It3QPQJkSIiltD4ohmv7xaxaEOcSSbmEQuEazt3ZosdYi3o4RuQ2a6kTSemrOCjHQcUotqxDf2352wFR7kBlOkTaKO5f5fQwLx86E7S1W8I2U2zeTH3AFQJEWL6Z2qvz46PL5ThS5KtiWzzzjuEoi20HhxJDgDV+4RqoH4DY/KcE5IUGUBvAs/E5udcnira9ZxTnrq+A6efgXvXpnOqilNR5hq7P2vaF3my2ggsadijj/PQuhMMUCnrzBqBNnVsMSGO9OK9lAIYMscIwP8nolc7O7tvKtnUhAI4/iyYBFvdXcVFpIktjuIGCrIxoSBpPpyOz/fEqXWCa7gMHzz1RUCuqNT+2o0a2KRtcaXf63P3HSe+xoDfszRaQTgHD3SYXZGO2p9QnXPk5anAstOnk+qmFO0wcpBfgI3HNib1ZMbPA/kHbwJ8SldmtRsabg79obii7yZcdTQvNJZw50LJcfu
Variant 0
DifficultyLevel
584
Question
Paddy and Miffy each bought potatoes from the local farmers' market.
Paddy bought 2 kilograms for $2.50.
Miffy bought 6 kilograms for $7.50.
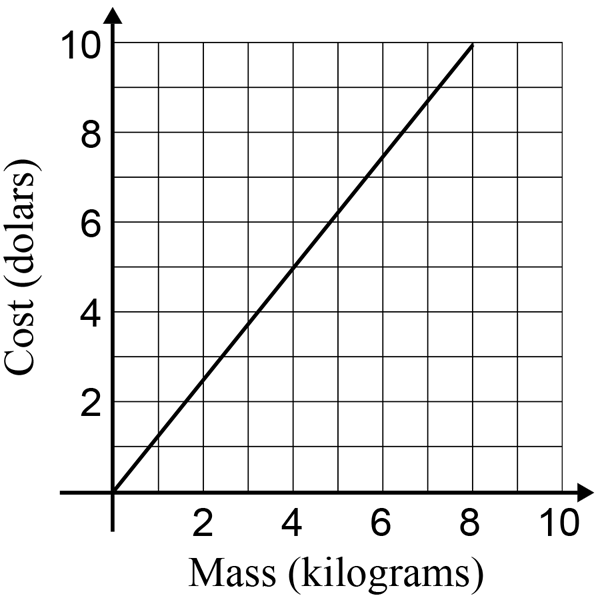
Which graph best represents the cost of potatoes at the farmers' market?
Worked Solution
Question Type
Multiple Choice (One Answer)
Variables
| Variable name | Variable value |
| question | Paddy and Miffy each bought potatoes from the local farmers' market.
Paddy bought 2 kilograms for \$2.50.
Miffy bought 6 kilograms for \$7.50.
Which graph best represents the cost of potatoes at the farmers' market?
|
| workedSolution | |
| correctAnswer | sm_img https://teacher.smartermaths.com.au/wp-content/uploads/2017/09/NAP-J1-14d.png 260 indent vpad |
Answers
U2FsdGVkX18AHiiOwgg3OWn2MvW60mbE8EHjykzdKRC86D06uk0WYv9ijQbrCJg6LFVgOOfLxhskgQq/pZcOcudHVfQEVcVce/vr9eCxInRDIZOrS3oM7i7aQXw3T+ExOUBdjK98UJ2xc4gD++aw5GuKGfYyEjdd4JtwdVinctJMsB7nZ6Koiphtm9tkmsjlHW86SHetG+lPrMjp1yLSd4osLTcdTlQ0YxJKeT+Gub7SkCsUhn08fHWL7x1h1X/62vl4TwEijqL/xo3FqxB4P2Bm3PaRsvNQ/M2MQqFTdCh+KXbWHhFuGlq8cXTyE2BDd9ePe+wf0iQKjUCT0Dl2HfpVcX6to1oFCNEkN8LiGkT51k1oA6BjlKsTm4B/eswsblzcK3BhX+0FOH8AUtktYHX6P+9IQ4SlexQVGrKYAkugTC/3QSj7MXTwIfMTRiangKMyN0Yxpnj4D5/KTfLQ9HManhLNCxFz9sjftRwwShEVrYnOYlKCMp4hLXtvYjVGiZJ3sl1gwLG7QSbgpP0LLMH6sFQjvE/Dq6WDVvos66/z0G1I7m8FJ4q/O7k6qIHpoYMY59rmaND24ZJchr1XQlBcl/27CIMfggHF5pC5QPVcJdvS2/Cw7BfOS9NwBF3XJa4ug7eL2cky0gFwMy4yU4DUhjBvJeFj9zk2GQu/LmDLikk/59EZxclqwEXq+ZrskI8y2rVRtUSPoslgV1t1vmFzxy2jPGlfVmbWLJMDsZNyctOFWIEut4gsM/Dy87MpWBySNwv4WeS8qbdLsMGGI3h4mBaCFT+yx6yI3XMXscNo6xRGFKr0Y9XxRbJFJe4fKfP56KP/DpkVEPVqttpLw4npt0NkWxl/q0zy3Y2QrWSmjKeQdWOPFwZN0XIylzypAutho35n2N+9nOhU9IIINenbexNuy8R02x6XzLN8IN0XrLdilAjOxuimxsCSbEr72IkdSJerxc9GoX7aH0wn5KDYfXc5kkqbfiEvkF8wTD/eC9lnoJtrmTNflkmKgxGFI9pjrbS88WBrenwqf0PjdwTeCYj+5KOsgVQkUQr34Mfo/zS8WlTJIikpmjwuko5j3bwKr+T7bUqDe+EIDTyGuAdzxzQomK65BhsacqYfQC5NUOAqppFwY6Ph+pOGoiQ/h1v1ii2U8o/CaF2Fl/DrT9/nSzatbUQEPqVfjyhBs0fRnmdDMzzREAI9W+J6iIlU8sxG+VAwQTgpmv/N/8GY0EUsaWgROcly0PHRAxN0tA1LWcGnwgjbu9GgJbjUS8iMxH5QJaeLkAYKSyBLESxxPKVH9rYpRlR/BmjsFm1kpta8rfkv/QcX0EP1FjsOsGvB8RCpvsgxmA51ii0aUqPZzmEuG85VB0X73DW4b1qjBYTZ7mikeytWQwFNmzoJDzm9LjzIeUTyIvY/4Qa7lWwDH4DCACQImjk/nzuu0U8nJMK7jaZgNy2/s10YPOkMBP9qsCZDhDnuuzXzHUZ/Dq2JptSAAVdSTWxsGV+wcwKdWsTQn7T8KzheWtxMpXh1TdMqYaL/KTYWvyqEdn1IvPQN+cXplLNPLaQ0Nv0RKGD7VFW4mDBeZunOS8qNsxjxuXSf8tmTd3tLEVU6Pjm9HFSqTmQAuVrm6s+E43u9D/smb2o1IPE+rsZ1R7Hh8F6u098pqPc4UuR8sZfpPd9TTokr/CNIbptnx+lWQULq48AUhCHLgDAoFfyze04qyM82x2FwE/raAKZkggd4ggUzoHj3M3OJoPjYVRTqGxNsBAbktjac7v60CcZ7EvCh92/dWiGKUduRaesSAoBuxL5JSvkFKOp3MtCJJENz3vBf7QfB7eJB+cILkIFm00wzGmyn82NzbrWSOcXMme9QaAkUcz0ER50LWknvsKo4V74j34xnrEHSE3g5ZfT+t4m6DwjzVeNZ3fNmG9GJq6mFFFONRt55vVAomuIaRmYSHFOwMy71EbmemMP13XMEUOWjATg8tpcjr+C19+cCN2ctYaadRl7cVVQ3p1bd61s167v4hHrHI9jrB3Kt47doXBrooEhUW9quvayCEV9106bW281x6lVmcTJh/4BLkUjLMzh1fER/fiKp0e4uO4vM7Q41+yq8ok3LDN5Xgz/63cgxosxQy5lKHxgc6OZkGl+2ceuLYxva9Mlqxos1qVwekyPoZXS1kjqcB2Zmoa0VrGQbDxhlhyOzemuctBII4LVN/HLlByoEKQM=
Variant 1
DifficultyLevel
572
Question
Jake and Amie each bought apples from the local orchard.
Jake bought 2 kilograms for $3.00.
Amie bought 6 kilograms for $9.00
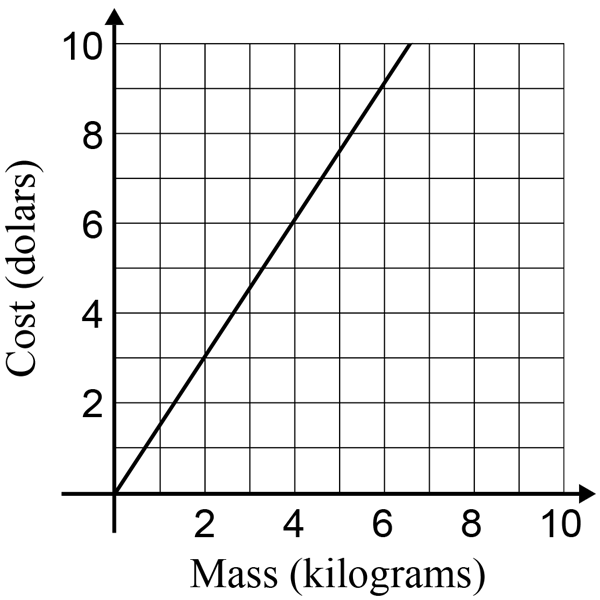
Which graph best represents the cost of apples at the local orchard?
Worked Solution
Question Type
Multiple Choice (One Answer)
Variables
| Variable name | Variable value |
| question | Jake and Amie each bought apples from the local orchard.
Jake bought 2 kilograms for \$3.00.
Amie bought 6 kilograms for \$9.00
Which graph best represents the cost of apples at the local orchard?
|
| workedSolution | |
| correctAnswer | sm_img https://teacher.smartermaths.com.au/wp-content/uploads/2017/09/NAP-J1-14a.png 260 indent vpad |
Answers
U2FsdGVkX1/9nWxavCc5euq0UCq3lvNBzlbZKMnXamIiTgATIOmWdFhITWrBK8kbwl79elS0ql8KnDKBqmw8WDmnVnMokphD0SU71UzTqhNeqpuFlHP6QwoDKIM7SWAedzD/THVrdIUn7woUR+ANSBAZAQrd4FjbkbfxHUFjbj7J+B0ww2k7lcNA3ZHI0pToc2r4WBFOQSq7GusPpD3m2IOge8tljkLK8gf84YCgYtt6KJhaJCRv0SjSWApNEb8y1AilT0PyHgfZturqkEdXBDV2AqS63E31hJ5AF2uFlrDT1EdjSl6HuBYqOxxufjoIQh/cFW38gJ1SrZpJRxTgqoSkR/f2NCTgpulRIVT4xTJqWmTxrEF2rP6GFX1CtsMrOLk+olIr8cqfYgnzO6nzmK/eWtdxbpKIoNpk8hCYykYy9vaeRSZ1PDo+lwAAuq4lQGe9hmzwbSYSofFA03pjcVu1u/SB+IKgQS6N+lbguFoC58dIHqklZPN1bvtDPCPBFMt71V7mmTa3DZvtbd+kL6KA2OjLKec/MaAH9kuRsAQQvOs0Io4hwll39FmEEopAWuMI49UsJGYexZtomBbxRwbag7Y8jdUMLYz2ATlK3wyo+KL3cqvIB8fiot1n3UfEKDlCPjn03n3LV/s/6al36powrmehcSQ4Ke4rGYeJqAzMYUOa53JSrqbfU2zrjXigZh+V0ZfMbXRox80Eao+h/frsu/KjfAD4VztdOvs6wq0kYEv1fYjSOo9IXUvgWUTFyAud1YzokyckPki52aU+bBxKuhu/hvtZos/BgOx/IHisBhWgdItMFWFCydgQ7a4V1B0NFiZM4xNrk0KvBPhOtw04HIgNueDNuQVJB2ZqiVwwVQ4Qe3PIbZugg2AK+1AFd4rX4RibpQoXZ8OOEjGYEUyKTsUuRtRpFdzJogVXQwCrbLgWQOmpEPuocmKgJN33gK8cP2CU+cxSHXUjF0c9DhnHZs7+MQOUw4yJPSX4S4zOu7qRpIA3fhgNHFWuVOp4OVnhag1Tt1zq86aEhA4z01rsEwu5qUfpa0bLClzsTMEC924lmAJY24zsKqKV5hl4TBprPvVsqcQZE+euLwYZU7Z8GAgh2iquk7YwZSlqcLEsQcODbgzpZncno2ihg4vHwKdlsq8iZaIezSycUviXyoSuWSXjOfUWRKwrJY5r+Fpb1BKnT5p491+OYNv8ElBnhii4pJoLXcu9SG2N3bOGjSS4Yp7lXDEiMZyuiDEPmX2Ah6ByNNuPflB5pnwvCK7gUWhcWEri0I+zwRpFTqRWlipR2hofTp8uEP7cexsWJpXbDWFhR0f5DHE5f6t//7Uvbx/Tfr+ENjdDDA8/Px0SZ0siph3Z1c6Y7fkoA8pv9iZNHOAZb9rMujGrI/rSObjfgm6eJsF1sq2kGI4ElAZIgZyuqQYq0ydDveFVzOBJVpUQPRdUS/CdS9h3vvVSzXLwQh+t19HuIac9c/SCfskaOT5yOMSp4+rL0Jqgbo4zdM3zd39TsHCuEmE6Uq06uKwMUfvElEorGSasonYGTT2oTIg8mj+Z+MFIFuKFX4fs07h3uc+m8XLaX8jrNt8xs2dK1AOqLta/t0gbxVzPsp/uvNMkN8fpNq+NayOY5OI20HYVRM68CJBBp46uWTRgj0feGglCVycZ/meAgfc1AWDy5hzcCZT1tL7I9jsnrIy+rs+vqqz+TsLxpuABmJfsb+rcqsP6UOfSHua8R/qIDnY6yjt5G6vtT/MALZ8qKx5GKHCHH68fAQMyvGr6LsMBJbAaJIS/WnoDUqEW5koKl/wZAGYopDU1DObVMy94metdSOU8iIHlol8YK/Nt24qzVH+Ts5kFWcXD1TJF8FKhLJMB7ZjCbt7kjWRM6KB+zBlQEWzxDfIdEgD7vfLwdi4I//Wou9rtMwH0WMS+W7SSQsMiED0N5/P93Ur4BnSmr9F9Sinl16k1NerMJ5NmYGNQ8OU+kjx8ODj7e00mC6P+pz43TnMBlP7UUlRk0GCLc8rXs4C71/nuDjw6NmrQkOQZ0rSifY7+aL86I4qvGKgVCo4KK61g5yPD71khT4uYhZ0kV/gTUn3J6+qQF/qz1BsSGD25oS3Rmy2LeTtwUnv3P2IT0mwgkaw7Si+ca0S9+wFlTm6pjairkUMnkG8mrAf0k50A
Variant 2
DifficultyLevel
564
Question
Billy and Bob each bought grapes from the local vineyard.
Billy bought 2 kilograms for $2.00.
Bob bought 9 kilograms for $9.00.
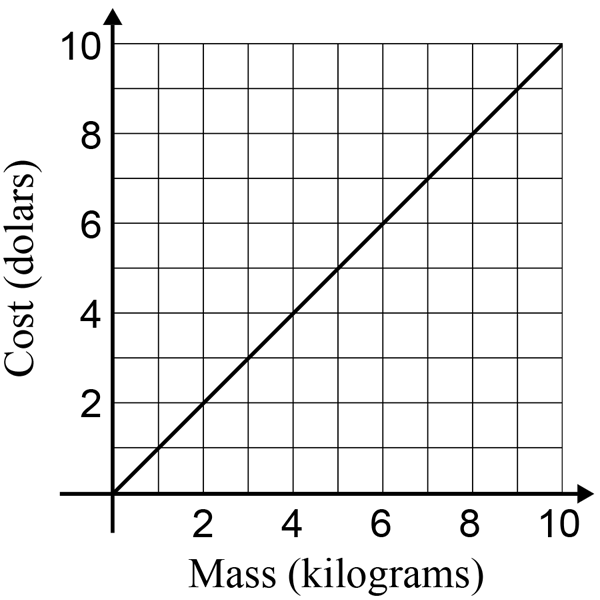
Which graph best represents the cost of grapes at the local vineyard?
Worked Solution
Question Type
Multiple Choice (One Answer)
Variables
| Variable name | Variable value |
| question | Billy and Bob each bought grapes from the local vineyard.
Billy bought 2 kilograms for \$2.00.
Bob bought 9 kilograms for \$9.00.
Which graph best represents the cost of grapes at the local vineyard?
|
| workedSolution | |
| correctAnswer | sm_img https://teacher.smartermaths.com.au/wp-content/uploads/2017/09/NAP-J1-14b.png 260 indent vpad |
Answers
U2FsdGVkX1+tU2jorvMML/LpvN8IJu7X4RvHuato05Rz+Q7vDqOIAxCwYxc7f5PeiXvsaKN9V6fHMMtmGA6sfnyvBoqonXK513B4SY2uuMO58UtDxKSb0S7wpui+Wf7O8xLZHdeZbTpqdCDCVsofJdAp3sC5TtCfQ9/M+X4APtTU6MUrAfs9Igk6J/r4qHoCKRXamV0Yw5PepWChmPk5/RH0/fZQYKAhiwUWXA699pzqiA9nQOolYVR6oqJh/paNBy5sHlns0dJfa24BnfXcJRa710GA2BSr9JBJyigoSED3GIrGvIf3LxFRUJVCg47tMN8MGbuJskGxPRzfnPlTAdi38qBxh4m2F8t8qSVQzr4XzR7wyU3FBOn/xXt852XBn3FIDJj9bDyORvzAJUfdI1tJfwtatL6zmt4Z0PDWX2JJW0weiB0zekNu0ARqXzzA38uEOG9xG7+nc8oEw+h7KpFgSWHjfV97Q9rpI/Q/tT7KKRR4GKeE9hECQCtmhgCG7sjvQwBjplbBaAjlaBuEA7w8ZYBrjlkWhOTMeIBnMdel2qbI0EOpfAU9PWu7WsFd0jPzN6SR2psY5DD5WOcn4gL02v8bvdhwrYFOXOy+PHr26XjXyATvOcAV5qicCY80YlggvdURbVPklwz1e6l5f0heSpgyKYf7duN5JlMzRy5lIs25ftj26bEYahYKSADFS41riLYSbbyVbIZtDcmk4m98QX7vqVReLR/RpKE/cGuCnf64xI5qGSb7fdlc3tFv88WIVHZUPIjhatkm3oSt8bZsOY3lul1zbBAnT3+vYFN/qwaAZ+mA49137wa8w63W7w192skqAgySEE7ZLcBM/NNwOb9mtjCDYFYZ/p27KqkCEGVoSffcdqoRMS/FJ286H1UrjqksfHcO0NKPOn09Z1vucbqI9kp6lYHUa75w4Lghtn+6rsCtzSEPlWZdX/4a+mMduELuUf2pKMTr0dZZFOV/GYp5zDdbsw5h+4axRBhdQrkVL9Xpa/UPgjStV22UTbOPxtOfvq59at7MFlJlq+zX8mr2WRuacazZBjdBYgAsJ4BpTBSOJeLjpOrv13X8wu0bWFX+3RAP4rNrJrqVwYitg8xv6OjN2HbbiO+PfX9JhtSk2881+tUbxOwNmiv4Q/ZQb44bQ8eMOD2sJ4fcQHsQPBjCYVr3eYDYfRlad0jz4lSmGdPnvT7DYoUg4fvfFSyUBH6IxL3QHtNQlNOHc6YImS8bnBiZk6t8iQY55etzSbnR8BJgNBD7+94s5/Z5F4EyenHT1v5BBlvfD2q2xjZuqgLl9TpJlkp90yNxumFxIuRzxOHzfX3o4yNuHcOv6KwPG9Mq4WDIDaU0r8VVKRs3tpF+6felG+0KYnUDPs4Im+vK0L6pc9rBIVTqhOqFUeBep/5fdjhJtrsibozHbJ+drOHDPAhAKX62QvjYr49zTM7CGVkmZMCf8juu9HMsHMMTaJlJR4v8BuxRdBgK+Zbiz/FLXV/RRjwgf5WWTdNeBabyP2/BkxtI54GXcxbxFDIgpfTjVhzJOcSMNtCAowrwXvQP802u86nk+9DNwTlI8QF0S4XCB+FzeTC5ggAUUwGU+g7K5AUG08RtO42mpeX0x1YSqw8cZaIi3zdIW+iAUq7sgyOqYkuc2kdrnfEEcEXs4LqxqFbSF6aBgN7nT3aNKhhzcGnIzdQALbkHwpzKirZTXin68+HK4kdBH+pzua1EPfrULpMK1745iUcrvV3SMXE7xS6jgme6uZH5VD1LEJ5fVuuQhwJM1um+wU86i+sIGz/Fp1s/450Tel/XZb6clUGpX1Oxn0LmVjAmxcPylrye/LJc51TubxtX4zw0d1wNwSHmBn8Iezt/uaERa9iPR15E3w6pBzpkA8uLcw+GNkESDCTyuyL+tPXvEX+m2cl7wjmk5/RM4Wa2Gc9LuDlbmWu1eR99UlbHb+QBgVPCenTTcdM87VW4Mf//Ta7pVVWa0NVDXVCPeAJJcqQeCoJloc+vffjwUxnl/4bTQ55Dou+RP4a5b0B4ZS9A5URSVhKq9ZVVk5+M5NhqEkkRvQThrKAJCAWDEoR0zBT24XWFekiIvtPxonMr/Dr/iaBXg7852WqaxpiElAJP2L4qx/Yb9uquMDgJSRvhgxAEX2BPjVF2NKz2O9D44pQyE1qB
Variant 3
DifficultyLevel
584
Question
Balou and Akela each bought bananas from the local market.
Balou bought 4 kilograms for $3.20.
Akela bought 5 kilograms for $4.00
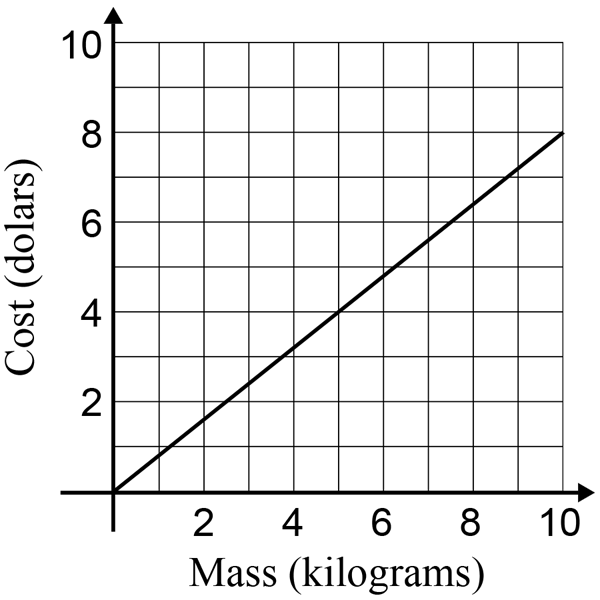
Which graph best represents the cost of bananas at the local market?
Worked Solution
Question Type
Multiple Choice (One Answer)
Variables
| Variable name | Variable value |
| question |
Balou and Akela each bought bananas from the local market.
Balou bought 4 kilograms for \$3.20.
Akela bought 5 kilograms for \$4.00
Which graph best represents the cost of bananas at the local market?
|
| workedSolution | |
| correctAnswer | sm_img https://teacher.smartermaths.com.au/wp-content/uploads/2017/09/NAP-J1-14c.png 260 indent vpad |
Answers
U2FsdGVkX1/QCiJC17HBIgyx28Czm50wcv3on04RE2J0UB85iQFfCIWf7UHtW84+iqroROcyEp4rcKQoYC6/Y8c/eEXH0rjsxiHWvzQRomjQyGqS+NkPVj5MWkeSXTkhXtopM41vJTgtUbq6xXYY25ho1UXGHH2Yj3PGexzOVk/Yi6l4ZhuWYrhlMwVm1ywK/S8LKgDV72tPrESdJwcAVJW/nE0Ge3AyZPWZYOpkPGSyoH4Vx1/WLnRfRfK7v2e9Le3QPjXk21FQGQsD5v79wASEwlUjq02pLoV+cyCMAD0PBa0Vl4MkWbTpZwn9GiKPv1g3g3LWL9IHzvrKG3Le/uYxU5CMaKkGtc6z8Cdc6CFemU9U3BgjvqeM7Bu2eRX23CWPXSH63GZj7eqXnr4UcfgTgz1tK7hj5ZWPTUtSZ6eteaZj8DvvnqOc1xxixs+2kd+S/a6hOigyKyAfOT5TgmeNrEi7T5dm2fiMo+i6UaX0jwEdjyIOFk4aT7DUuCDiAs9Ap8/hatdyddrLb+Pv7bksY56qJpByq8uS4s4HBZ9xZZYQ+P19bJe003qUsB08MG16WVzgCnzWMeqtW66bdK+MHSN35ANKbAZfi6hVtQvTC48FChibrztEyT7e3ICICNxUQ33Sto7CkYLO8Eh4Hz/fSZ6yW7WQnCtojQjF50sW72IUvXpBXHTsvZcJNcsrtH2bFsVO/U4D9+JPVz9tPvWSTBVRXisZi8adK+WthB8dKYiKSfslzqIcb/Xkk7cznZI6t3hM3WOQodcCyvu2qccsWi3BsZo8Oq6ci4CEFWD/WBzXHDE70KUYUyR/8UGRMYCqd6ewlEDRyMMi7cYvUmdmsyDgYNw/5qHw9pOaPohvcomYA7fLUy8fF3Uy4gAdO8lsRGnX+YJUu+v9w4v52Pl2NEfkiCQbiScVxsqAz1citjvtO6FEMSVwwiuYqmk8MWcvtxy7XXaVFqIv5CsgbpXf+qhdj5fd+felFB6L7BQtoZRKTqYUkAWJU8hEp4Kf9FeLOWWyAsUzZTZGgKoUCLXx3P2Ctus6Yul3ylD8LrrJ9j0orqNXkcXV/32NfOTBgztfDFyU8wKwx4+nH91s+D+zFFoIFa/NrjWJKu3EbIDPNN+I4VZqcDQF9SlwwV5+EIXJQJeRrbRtrr/MLdMITt524J89fBXJN9j5IJoe3e03h76IX5cpNiQE9bOk1bIPjxUwJT19bf8cowgwQyRcrqn4nHMpnvzect3dL4Q2eBPe4mAXtUu5loicHDBOOEUNOhQIoJ029cJf8rAUAi6qFcjhQYF7myV3rzNUbZjpfpod3DsHTYcBmygcCOla1G7yQZT36N3EF3K8jqwEGsFCXrCMK4tV2psPsG5gV0M5PltjYavWiM1yoMcu1ZAeRYtuPDXu7/QZdbnoT6onW18k/b/2hEywClkw3oFHmpBdd34CLyBlYnJ2pKmw0m+k1igG3B7tJRVj2Pvo9weK64pUBYu2eY/+37cbtDjotqzq9q5lfgMJiySKek/Y6d5Cb4MYQ2LVZxRLGZkDtuDW0BhMbr9Ba62oTfwz9kmBXVLPb+HWpT068K7bKAlpJgwpHQDSLRpICfqvJAmDJfcg6DX4awJXCUeL51tA5ujEaiH5+eZZa6N2ZUX2Qq8EO7ZMe0vyP9P6VV5zlYAFhPWeZRNloB/r/TQw+bG0cqXYxivPvYcv5m6sBpENG3mapby7MX72VhfvVA38TtJRgbUNP/O+e2E97JrvLlnyTx30q9IxDI2J6TDjLKSMmpvHG+SHyjimAefz4XGjb4kg/LT2f73N/yRTpin9e4PxYsnGDzOeFf4xNCE5JBNRB1dW5EbYwd/HJrTd0mch5bKmhzN3TN2N5LCv7GSkWNopQ3K/Qj6zwROMwvCqTqT+50hcopi7mRIOniHFeL0E2E3mZGArDTOvK7i1Sg2yVqvmQZYliNKaIBypx4zOZxRzj3KTZMrKscE9tIMX35UyAnTAs3jxCdpPm70H394WZxq3f4LTADEEbuD0NFFXvtjOc8iGnLvBkw00Q527uxMsW6U5rSkFaFlR0N/0jsuzUtIjRoJbGeuGMAKissenngOP+yJN4Z7N+5NB2NM2l0p5xq8pLPqFRUsKNRWS5vpz+56llkOsKY6sMaY=
Variant 4
DifficultyLevel
586
Question
Buzz and Darby each bought rice at the supermarket.
Buzz bought 2 kilograms for $2.50.
Darby bought 5 kilograms for $6.25
Which graph best represents the cost of rice at the supermarket?
Worked Solution
Question Type
Multiple Choice (One Answer)
Variables
| Variable name | Variable value |
| question | Buzz and Darby each bought rice at the supermarket.
Buzz bought 2 kilograms for \$2.50.
Darby bought 5 kilograms for \$6.25
Which graph best represents the cost of rice at the supermarket?
|
| workedSolution | |
| correctAnswer | sm_img https://teacher.smartermaths.com.au/wp-content/uploads/2017/09/NAP-J1-14d.png 260 indent vpad |
Answers
U2FsdGVkX181mfpqzTC40cGBn/0dyhWxAsKseEdsgY8evOqJ92c8G+Yf30rpsmgM0ByeEZJE9Tz7VpN9gXhuY8XsO1s/daxGM3bxL4Yz2iwv/SEmoST1B1mSViS99+fyEnr8CIymwy1do1NF4CK1t+mSaeFgL4uobES4uZ1onMyXt4hy8crT+1G/t+kJ0TG92RsJrHobTEvRkShxxzhGK69DOZlfRjPsAZCiFiNJn4aX0n9QdueOQnWh5+nFFOtBQCLQClja71lnyladmtxL0AMX98QFt0JWKbwY3/F4KbBL0dxMk/fVKubYCKB6fCsP9W9Yaxc2TZi77jL86c6BMn2QpKzX2zgyCQVHa8P8Npdiqe6OZe7OspgALOqFEOgtydwE0sON5nxetNI/01mVWJzriDoQh41hBtz0TSz1p/eXaBQmTFkaq5b1btm4AetL8E8Yrg4GI9qRWxAdJxEyJin3o05pR6ljrMI9cbUVmGIKhz17M7S/3mjzBQwrSSQXCwR+jVVmBaW0FhZHTh0vhIz/ZxN3BIKjCY9vCWC9nCSBmGd3mn7wBP8TrIiLwQWJKY4xMax5prYxDiqc4tEVd3JOxQEwFcsgBBeV8xsSaRuVtjlyROTS7xov5+xSS8KZ4HvNalVT6gZ5Kl8ev8qzENQZIKzinAHrw+7mZjXo21qXXSTfp5tJnaYbvYYBqnUB4Rh+odagaFTt4yJR4N4+rqZjT4kGn+JUnGk1Fi3gr3zcVfj3OEZkGphRKjoFDWi2SJVJcWPiTeSdWGrL9tS1SvSspO2idp3lKOWpZN21davE5eOvFFy6OSrtxVZjZHqp0+YN72MUbjl62Pm9zUJKBKW5qqM5cPBhPDTT3q9pvqaUzFgafUf5dqzQjeYOglc0kvwbW5L3NQIGSwMiYaaA3wkGptbRM1N+d6du/0yQWA3w/FjxhPHZcwqgEiILowiVUzfxlJH1hTGbSbGvVjKX0xWpuD0sgBkcXXZOH1v8LKuhmlpm0usLwEa0MXqe2iXesDNPGg61wUOY/rpK583n3S2RKCmsWMW/XlqIGmmUTUR+MmlVGkBjzEU6BOhDS90Qqghi164g58AwgNhpfvT/bx9S6KpnrGVMJ23bajGj9LFtnvuc27eYaB8u07GTXV2TUmgdQqeXfdObC4opJWUCiKJsCXJvLnnurvmv4bUJvWU7JLYqje4T3cKbGvtT6Xp/D4nOk7UtmiSQl2WqBIjcUe3g6rF7tSg2bM6zh//PcahqQSN2mRNONKms9p5707BS5DgZc5ARPmOfTH1NDsJeo/bYtUylyYnOn9Gg0J1N5AeRPZtY6twjGMDghyFOG8XlFdORLS4Ph6B0zMJ5i532E4ugwmWNqzKmXuwYcqFvOrhsQBjs/6q+HOkP4K8aWCkQt5gH0vM/3vHofJHxfnxnMOxvu0RHI1i5AAnvwuk67LBDzIhFMUuDxYSGybv3+Olq6fUGz69tWIjLlwN09gTMzO/QvRwMK+NVimKQ0uDriuZWWo2fMfbUwOLNlPAj4hhBFS4niDsMmqyiPU5BbCQBrFMk12XPv7VY33h3vCdwF//26lqF9FFKqjfc1UUZp3v2mzjky78pWW4p6CeHWgIHq3behHV38JhAip0zv/J3Lam7dlHR7axhoMcMOJ0H6VEWvNOi13vW17Mx6/EKDsqYfihtVSxJyyGmyR6efdZw68TjUey0IxpZtVadq6HwP9DSHuL+adO0s4AEwnkb/NcXmY+b++uTJMg0pir9/JLV/FQ5lWfX7P/SiGSlVlNC5iHjh3wxIG60EqnxhrP4TEbY0T6F7AttGRfYz+ICm7q5x0VpjOYvrZE1ScwMdBMSAX0YgCby25xySGSBDg3M2ptPF7vq4rM2i+EwevonNauPCW37OjVoPULeXCxMHbyiju5eF/rymhe7ct5IQhb84fkTXR5uutH3s+MLCMgmlQhDh7vHC8SrxexkMmcfd4O5aDIePcXvTKDG8enQzLg6f/jYQmd+9nbZthtgtcAyJVGDbwpRJ0cAfHg4I/6upmZGlas4Umtuxq0yIbUQ99PlEE2YCc/wtqe2En6d/3dSgHW8m7FsMAILnaJ5pZgebG6lAdIEqErmJBmsyA5D+u6iXf2jOhBTvOykVVjauoIi9fR0814=
Variant 5
DifficultyLevel
577
Question
Nemo and Dory each bought fish food at the pet shop.
Nemo bought 1 kilograms for $1.50.
Dory bought 5 kilograms for $7.50
Which graph best represents the cost of fish food at the pet shop?
Worked Solution
Question Type
Multiple Choice (One Answer)
Variables
| Variable name | Variable value |
| question | Nemo and Dory each bought fish food at the pet shop.
Nemo bought 1 kilograms for \$1.50.
Dory bought 5 kilograms for \$7.50
Which graph best represents the cost of fish food at the pet shop?
|
| workedSolution | |
| correctAnswer | sm_img https://teacher.smartermaths.com.au/wp-content/uploads/2017/09/NAP-J1-14a.png 260 indent vpad |
Answers