20325
U2FsdGVkX1/6pP2FJG+6WOARgFihZ/QOPgkNl2cMd5mTdw5HsIE7ZMpko+PtNSy80BbRX/wIaN5vLn2QIX0rLxyDSYZZ0QCsoPVe1THdxvxdCRG8MOyIkJyYu685eHlP7tFRBilbmYom6LnBwwXvN0x7aNTfmI0UoaBt2Lcor89b8X8PIcEeLND1nT44wa67cuBf+rP5828vrlwWuSCVcD/vE0Oe2tbGRTFkStgptqXdjV13I7klArIv77hWWBLoKT4Bf8KZamNe+k3xZNCc7KWyVBuOsfwTyRNXri+CgR3ZeH5Kym6mQVDh9Jti2Q0F/3iK9eF7zShGkuSHa2z3o7DOmPueJJs05HiYGXAgEjJs+3N0iQBJNqUck6uRh4Rw1CaGOQKMF+hJVA4O7S1wpskhblYjWtTg45VoVETBSJuvsmL4lRecqaSPdjmWrZsmnBWaMVSba9IC5B4Y0HucAyK1MJhENm0HuEU3niuyOi1zIhemYJ/cGUddXH0RJAGSyVO2z3v3lEeLswMg+njclV85JKub8x7UGfL8vLxyFxucOc+sPBELmckDJ3g9cbIkRp7ty0vBmOkJcwr84koRx9AhRiJzGoq6wUT2gHQ8Z7TLHeYSTNBP9Gs+wJT1IZKltJlCXBNuUC9NOQt9FOABbPMAkY6DWJGvvLoBPjB/iF+r7IfWB8b9EMnBW4ZW/1Mm5Jsppffk04OpQKpqHe129HCBFUngVeVqARnWVDp+OFOe5UHcmuxkNE9ksWKkFcaCV96RSE2SiyKiDYcvDbPLYvcGqKjeQnqnN1tMThAsVlSE9gPlkWKZIB8KZNg8RpmXm8sQXxsCB9q/5hdqg7KUyQ2OQwSYUpnU26pZQRgHzZqdMM4hhkn4V9+dRcSXCP3K4raPQck1TIj26McPOJIW7FSnbJHJYffOixFPGBuk+RY675VS71Wl0zxTDL6dvezJj/YRZFu9ppoekm9qUiuM8oh81iEp14WURYp0fXRfFgQr2SkqId0C3EJeKt+OgNRlNQxtwOf4QAKBlVI76eUW8yRA95qPE12+8YxlCmxXMDeYsLQVcQ/GWvJjGcvdWWT6vW5cReRZeFhzkuMisJP46OX4ZD2TjDZrXOPnNVG0pRPjyV+lweSi2yNFQQpJvD4bcS6PJMw+jfpMdA/E7xDkWP2U6/heuipC9cgj+ePgAz0mFktE/P/BmEK37UqNo5DkgWY9sjiwOV8OVIBbJc/5UVMUOa7lwcxNV468FrGeb4C+gUwSd1doQ5R+RGFjPfFmzZW2pDC9UkmnoyYO8LIhNEiREdAB9fyLk+tQ9Q4QK/75CBMXYEi72tnKYTnsJs0J1Hw0GJcpDnpoKtKcDEllZzwOOW1qAJRGQEZ8kDRnqxWbDsQ5UENTh5XvhvEU9NvsWZF+z+d3iVcmYHYgAVyrg/lRzd04au+eZIBuogmQNdl0xJxOvoYaEsI47Zz82UHu659NDvAZXS2vjYzdo9OcH4s5bdNNbKQ4CSYxTQZO6f0alo5wz2ji0epUg/ziiQi7rr6wO/bsRfqsNJ66UCWgJkXbXGbJY8t/567oX9vT7H3/w1QuPcGkPbI5U7z4YVXiwCnNzgW5aN2ljd3YuSlXJWvr+5vACP7D7wA/aTsBz002un6Xt5KHwzgSATF6fFfVGmPgw4EgPxFgFJvNPvGnJxhJIzs02Zvqi7YRpRvx2LC1bzPa5IqbmRliozR/C+fQ/eQXkwB9+HuaQrSFOhQQTuwuYlrzT11tRauDko67NIBDGYmteQ1qUC4Uy+VlDA7jBsHNQ/430RUT7dqErFyDkiC5z83lp6vjsdME5FsLXyo=
Variant 0
DifficultyLevel
562
Question
At a pool supply store, 20 kilograms of salt costs $6.50 and 40 kilograms of the same salt costs $13.00.
Which graph could show the relationship between the amount of salt and its cost?
Worked Solution
Question Type
Multiple Choice (One Answer)
Variables
| Variable name | Variable value |
| question | At a pool supply store, 20 kilograms of salt costs \$6.50 and 40 kilograms of the same salt costs \$13.00.
Which graph could show the relationship between the amount of salt and its cost?
|
| workedSolution | |
| correctAnswer |
sm_img https://teacher.smartermaths.com.au/wp-content/uploads/2016/12/naplan-2016-9mci.png 230 indent vpad |
Answers
U2FsdGVkX1/g24duL2TvGxLAERWWiOsdxRTdDOl9PltXh8v/qd/RbTT9FMeLdxnjKdqG7LvXD0HtglPHYdnZRU1BmAQXquOZdt/RQPK9JXd1b4jT7Rca+iChgSmGAFnvZYwiIbduHK1an6CM4zPh3aN6ojZUfD+QFMRuG3aIJKhHfip6s7pNV3jRRSLblEdBj6avocy5348yHo4ct+xeUblBbW1o2SrvDtcDcgQWSYvJqs+urt6144iG6wpbRRQHepVbqAQit1IKmph7c3F+zWDi66LPnMdqTm7Ylrwp1H1XHV8cAJMOCd9X8Z7KqMzm4tgk+uSCXtNuLYvpsDUHFR1JoUo64uaoxJzmBc/n7RfPVA7eqpQcIaurGHx7spwFzQSpXyQieKtEV2GKfR3V71L93c9KLKZ3gaAG8jZONfYWi+x6bpGT2mOauCjpW9qGjdU5UEDcYkAUf6M1gdZYcH9XwsQWHnhbLffYgDHk113oWqrAUoCsQWxEz43gZroQwPjyEwFUg49e0/Fva9OZOPZrzl0T5466qZpUUJcfwKdxheG7IfX1/fjlwj2LyLkINw6cq+HmgAAj9cxqsQjHo6ZQjbwf9ASBLC9fZZ0pBntnBGaLrs4ph2ugotIVDMvYtme+cm+qXbBiR7S+d7sREUFOhvvSkIlleNpWCH2aaj2xpWWHhY24DceLsb5ImPGRcmyYGxGtoWn9d7zRVibIAPDJU9FwNqIXK0iq5x8d95HDF/AJBedV8FwxV2oZErAo1qcxWmkHk+1+pWhiprsLfIu1MHVqIVdHUgyS4BVlcRUyp1yBrtgwiKJ39jXYeuKHzW0Vc5duDZcrGrU02D/10sW6wNUmaBkRWK13J3/ThH+seNSXm6lXA9Ok2PbiVWSVsl1zEUg92ThqCVgWgoxnjIcxKkeX4raVUNbvmJaVY7OSBe3NKdyyEUygcevFv+tjwIFtPIeRUeUgLhFZDo6PQDMssj+lgW8XlJAeCFqfFdGNK5C2YJda0JUh6hNaxnZh/zNggDaCtRWnlLKUd52iylx3fXAh7QgX3tHN8IgrgPl9q0XBTJvg8AyV0YfFkeMVHG5mmja32+VN+hrjJ2vZR6BAr2U9FlmOSke5JBB5Y7BW8Q5iENe4vm/y0m0f7LACSvXVlURThTjGHdRRsWZjn7GxrHJQEOD3pUL2o2WrKHagoIEfnOCZD2e3jSZ3cMVoWYbyp2LL2bFAI2tzJkKZnuUfKClGjH5KSTnScOEf9RSmnr4FMFxIFKUKaxMpYRtzZw6P6zwlIZugjY+vcgVeYlzjB1igjfZQZaxL/vl/9znbUKsMnjbM5PdCBXLbXXg3rCm0oL7nmAVtY9A2O+kv9enRHd9FXsnAhdXVZ9F3i+UFkH51YZoHJYEb3lkN4PIW6iADNNPm9orwejjpXt0j0u8T7PJKG7g1qVkiuS8ugdNzVX3Sb3q9HUmE9pCMqkD6oUiFqyp0czh4Zpgc6X8EXyo8tYGx0qmpdj9s5bBWgyYEUfUzzF3watP1oKlRvNVJX/4LFasFqePOGTItDAn4/gmExBW5bIih7QfZy8sj2tdNSD7XKqy0JBeDUQGD+emtIIcNHAhuEgo2oBhj/hH9TJEpOPJFsDsLfTaAS7YX098eLArcxqhgRelXOARJzhbhfUfqvSZx/CHTX3vsVAHi4DLB9+YPNr0WUNoTcXZimEWrHeP6AHwh67jxGe5SsPF5/cFSOW3z7i/0zMx0YP1KxT2OHZ5BjfZZGfqXmVj6hiknKt6hzA4v3RBmXUq3AZSPmaatjh4Kbxxn6LZdKe6rqsxIGjsiBg+nCQgHZvzQHMai1tXoHj8+vHfmVnTbOZeY4MpzjGEav7tInFGVyao0RzWy2+CNHLx1BeQss05Zlc8=
Variant 1
DifficultyLevel
562
Question
At a pool supply store, 20 kilograms of salt costs $8.50 and 40 kilograms of the same salt costs $17.00.
Which graph could show the relationship between the amount of salt and its cost?
Worked Solution
Question Type
Multiple Choice (One Answer)
Variables
| Variable name | Variable value |
| question | At a pool supply store, 20 kilograms of salt costs $8.50 and 40 kilograms of the same salt costs $17.00.
Which graph could show the relationship between the amount of salt and its cost?
|
| workedSolution | |
| correctAnswer | sm_img https://teacher.smartermaths.com.au/wp-content/uploads/2022/08/Algebra_20325_v1q.svg 230 indent vpad |
Answers
U2FsdGVkX1/26NNMTLo33Grxk/8k78WTM0uQcpYMC+wPTeCsPv8Lu8BGJz9AvgoxhNEOM/XhSSwnPZUdZggnxffAEXPhiUhGfm1cdf30Q0voYWWg98KC/KWGskpWHF1PrOa6I/Q48bVHjk/kgsZsgT2S4Dly4YE/9AmnxzCYF+QI0wvxKTAHbidoigmjg0GVXYJ/eCMgvEr+QIg6+bxpx6NZbaNYWrNGk4X/64SlgsVmPebPCz3zLnQSnRZQYPGJYLtGUjPeVj5A4Zj+KH7ytF/ok0r1cHj2HxToLJAD+EIqoKFzYbQhLTkR9CZPvWWbj7VTH/UFo2Bvzzu89Ig6tk5QcH4XAp5hJ0kEKcOOI3bjGejFzTJ5gLvLW8O973mCPZJu9yypVV5vx5jOmylEwCd4YUpAHJjBMUYYC/oC1TOU4O8sU8ICZAVwHjrd5mN5/+9qb7vTr7s29tdNre2aLkGBWI7TUmyL1GlpaRVZ23HyoLZKnubjVY03u7rmYrHKxq48g7TFLlpGbepzweK53c1q7gnKjO5LOyt0THtrf7EyIMouEuDA4DN30VWYWLvTUxLs9+DPbgIIozzbqj0aHFvvPo50Kue8tjgGHlwAMVBLb4nHJdmSJSZDML1zuMd1IhIMxCSRrLyDbObgXKgML0ciqEgxF66KIBPrhYaAsJ9UjQvxP0LEqVt4AH2/PJA0RXozJpcog6JTIS965EhcOIpEqIKPHfulkn4FJSKP1G0NYcccprI+3wn0BZ3GHA5hL9H6hVwJFcqYDpttoFI3lKiBD/b7yOfY9e/W2eMXbNi7G1Sqn26CTJiWpw+CptvNm7LO1cKhdhh5x7WJM0nTXAKp0piW4PASs9StUIkVmPBlRv+Kd+BsD+XwssCGfBHD54z0qMofKRu3iHmIHPNPNKB+EsHimpHJ58796vPb3jVMFJjKo4FwBhhHQ6eNak8/U1yFglnTNPl+dcm2/V+jZAGcZZhyxqiseAjf/T/HCbK/pjWp9WP9jbmJkp8+4fa1O9qG7xQ0YmBceLQ8OragMOJi2EtVgJJm7+8XUYVSSiSrZIyZpvdGgRhPNd8rmLbk1Uy5pYn284sIucyXPbfxrtbzuwZRbRSj5z6JItFyalDnofNogzOWjCG8kRkn1G9Mo/d8ReZOjJNist9wF3P6EbnjVXWkJwgsGInCoXvFgFzU60BsM1kb4D8SauHNdRnhLcXVckTGVIJQUgoNMmFaqlRWB5Pro3yF7zIqGq4lGs2ygMV2vZR9831jO0zHl1jwJsmIe7IGWIPd5vXrYANamFTbWAadfVuDp9lMVdbgFkf06ohuHtQR8heQe6TXAr9KnmKBMinzBcHn6jY4J3aFNWAOz2c4SaZyxGxzZe9GMvpDXsopNK2buw8KqWw4rgPlNmvv1tqDPTfBLzFtGsRx9+sE+uElC46iDThzCFRRodoVRDQr1hHpNtT1YsRS+xR+AN+DMnZtRADvbtuZYCsH2PsT3LRoT/3KaM0fTW8sIIGYTm8WQ6RmgaufSOZS7lLerGaLcyfQLbJ5Sj6WhVGcNXt6e9ZODrYX4jTGYnEPbnVF0jEsLJ9brl8dySuN7IeiO6CLVpwoqDdWfS1ct/X1Bq4rkW2XhptM6LRBSub5fPrxwB+SarRW1/cXw6SKBKeouIYSUCTgnvr/PeQ5L8KczUi8jzN0zNDT8en+mfjsax3wffNwgDQIc9E8V9MrPaRkgkvJ1czPf896oJB4zshxiFVvyg7/iHxNShciaeymCyFJM7FaeLzqgOWTDTIfHQUA+nh3htQiBKnb7Oyx1z3v8bk5ihJ1VxCg1q9WXXvmdvBHFW61cmwW6sI6CwCHd7SPu2Xp4EOLpHTUh2miDbCyAggpyMYQ/Ke2L3dIVeM/pOQ=
Variant 2
DifficultyLevel
562
Question
At a pool supply store, 15 kilograms of salt costs $6.00 and 30 kilograms of the same salt costs $12.00.
Which graph could show the relationship between the amount of salt and its cost?
Worked Solution
Question Type
Multiple Choice (One Answer)
Variables
| Variable name | Variable value |
| question | At a pool supply store, 15 kilograms of salt costs $6.00 and 30 kilograms of the same salt costs $12.00.
Which graph could show the relationship between the amount of salt and its cost?
|
| workedSolution | |
| correctAnswer | sm_img https://teacher.smartermaths.com.au/wp-content/uploads/2022/08/Algebra_20325_v2A_c.svg 230 indent vpad
|
Answers
U2FsdGVkX18JWbgSJgXDrdFsmVu6Wx7wL8pMm1tqLrX42ImfsIkOWXw7ETcleNs9QjpqW2cX7SAb5DS81L3/UjP+JSAaPZOV3Dq2s7tDA7mgnEg9O3mH60E9GPpdxYYg68I4L0gD08xORwAwfV/y4ldLe1VGoeXN41GcvSjrKh5KgFFbq98oY/+9FcjhfxlugURz8ZopV1b2ZIR+wxqprTrZuN5INDxV20+CbaD8oAI0kX4Pf5n8rXD5GHPBHwEBaovQx6GV6MuCG/W4FfLJaNoDwkjoE80REWFZkVOx93p9evLnrTXUW0oAjrO4hzLUFbHFMAYMiMzhVmk265j8MeChaFwGl7Ey6xBTbyFYZD44zXb9dBaEC7mvlbl3S3biDmKduAUMW5cztQaSGnxfGmiq/UlUaI3uUykV28AaQfGBAFoALFPA2rGg3az2fV7XghyhXXT5IE5W3cOLuPH98/aIBZEHZHC+ww+8kyTGkugWivXGfCZQYCPFTayLUwJOIuaSfwQFjCJ3R93TnxIa97S6jOnajLu89c8R2fyQdOgkHcTi6L0FBNwmzI39nCrrNKuU8GPyp9qKmNli98kY0pzmMTiUper/gdjJ1o2nveBototdpucMAH1srUfJWJI3Nd0oukAnHf4jTNhX0Rz/nU2yBK9tFNKkUOY6IlV3P6yvccNBYdj8EXFvkIRTk/kbijxfTRkOAK0PK5/rJjPEUuOPJTUZOl3/VDV3mY7h/xtVmoxZPvVk73skNtXMt6lPlhPgSWFtOCiM414WiKyOmjLXiHrc4tNIss59nVOIVPcZXuRRkJwsbLow8lHH70OK865lJ1V5ko1Sm8j/CJqoQT1bHwxARPM58z//eitvCWRmqpjMqHtlgwaFSqCLYwA8mcuyumhjvkVbKpsyLvzQp8CdYswyOKx4T6RnDaSA3pxXV0F3ggurrEGhXtUkZO2YaexOp5S+TEP3SdXTG6fsh9GcCQPtuUxHIWWIbsf5Rzxl6KIX5f+sz3O75ei+t7BQx5hRb+MGII3UU0xO67H1Ex4jgTkvoelr2Kza4gkMysujAE+EYufcLbq4W/3Sg9ag1rqWzXVWKYJkuicX+kYGOHV3Ze/I4whTRDvKIvMgMeKNDlmjr2jnFD5zCiPqHBI4j7Vy7UY/lwtOxhtdmkHXIznUYyDFmizKcmabnAZRhlqu1j8VVm7xFomYK0XTLkOU1fVpa4Vd79na3EyKozEPAAeaALECx0l5neni8jNflKg0mgWY7RfehbyyqnVwifZIzwY0ywlEmoGxH/h8wwia9a7pT4BYKecRLhx7cRRBooQ30h3Jt5r0xG/qvzeFypDCJ3ytCvLhq1QgiyuQ+j+v2DrqFsnuV/yxYVmSVQfHjvv8mVK4F0omkoDxBUG960w7kJt3HhUqckqGP2alEERzMHdaPj9h45bgTfqQ9wjCeZJemTp6AfJGKzWwmIrNzifVMZ5H9Tsh90T7O0X95crKBWI9gAgFQXnb66gawFUanZs8FA4a6HmePnPrDHQSxCvjpKFrYUQYa8ssXFoUX5iafufpxsXbBGpzEG/5F+rZqm5jbpc51XEIOxjaAy25WKr9yCyh9SacPrjCByAnB1/A6V5kH1kGEgntECit81LdX4+pRMuwgzeV5I34xDGQ9x6mkzq7gjZ4hx2mSgzSlGVG/aQM4Oysia6vTZEIQAU+Lx8BRG70U1+VYLcRcD549MleWzQFIvJjXRffq2gYU8ljdqupfZEzKWPAWGGN5rNxltbgzleCZNodZdBHBap/mKi5dPoZD209cPhAxTCPrt7kgunbH+h1I6WX6MTKifZqOxyfVNjsdcpel+uGH+21D5I7sZDdRu+FtpylaajRvnrB6MWJjL69qTUkY8gBNizzdNE=
Variant 3
DifficultyLevel
557
Question
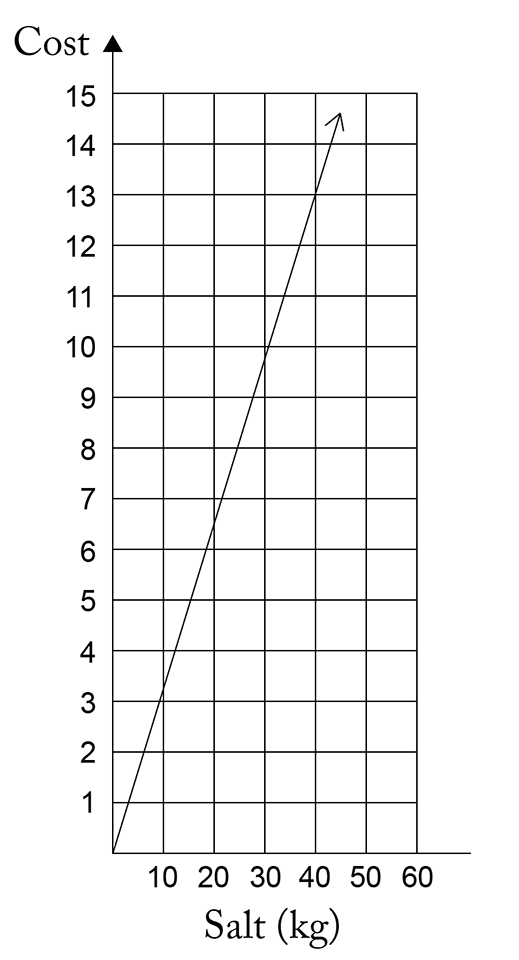
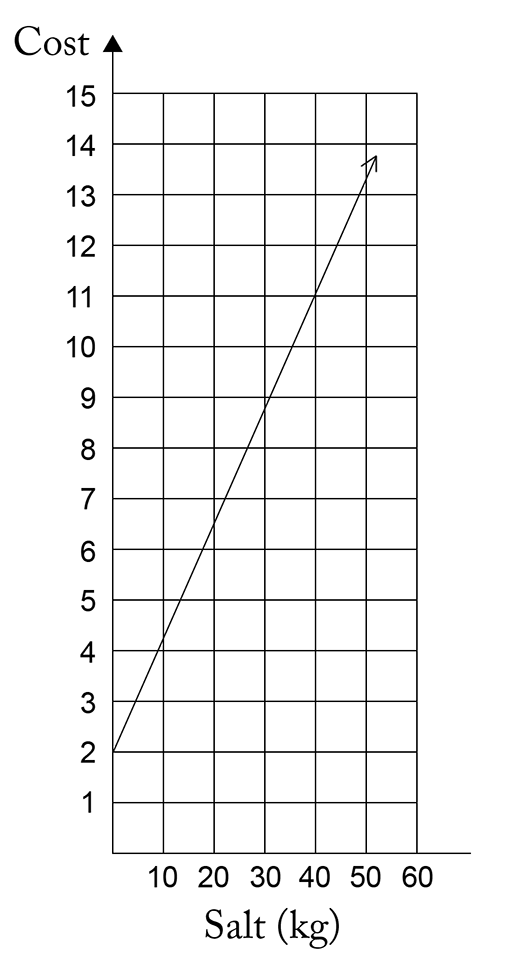
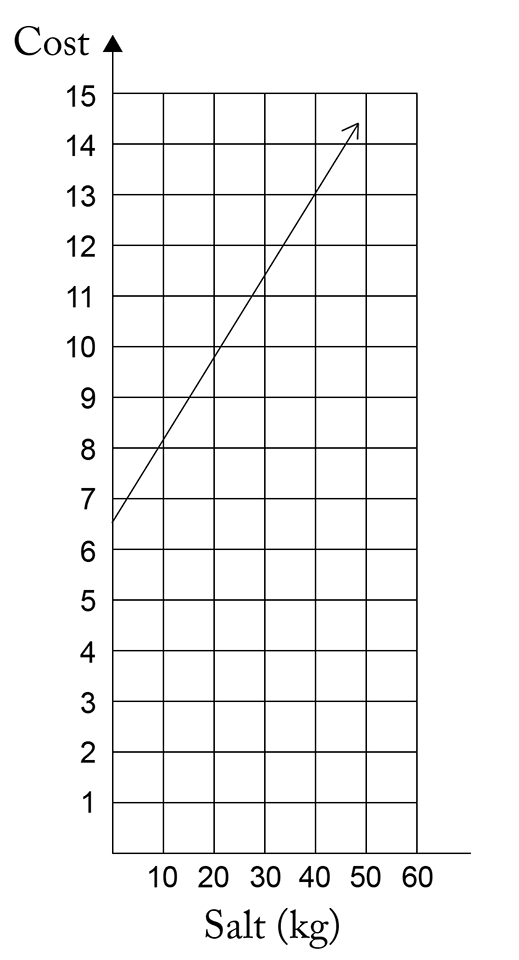
At a pool supply store, 20 kilograms of salt costs $7.00 and 40 kilograms of the same salt costs $14.00.
Which graph could show the relationship between the amount of salt and its cost?
Worked Solution
Question Type
Multiple Choice (One Answer)
Variables
| Variable name | Variable value |
| question | At a pool supply store, 20 kilograms of salt costs $7.00 and 40 kilograms of the same salt costs $14.00.
Which graph could show the relationship between the amount of salt and its cost?
|
| workedSolution | |
| correctAnswer | sm_img https://teacher.smartermaths.com.au/wp-content/uploads/2022/08/Algebra_20325_v3A_a.svg 230 indent vpad
|
Answers
U2FsdGVkX1/AY3OX5TQRpTucbAZLdy+CfbdkI5SC+JZHpuOTwxG9iHtDcZiCZYyMuDKB0NeIbw/ymykY6esI87OrNVoeXHIp0K0p/q2zTSYpTO1tCkaDmCzBy2QTIGskLJLLGeKpRqGhgKv2Ad/NLD4k+ekHly/omoAZuECmtEXiSpVzdTpHYhV0ctpEXA/fCur1883WYkhU1cmNfUWhsPgei0a606yWpSHv/eVu2QwwloymeNuh/6AQ3Vebz4Fo50hHEbIMGWbNaVSe0BP3lOEfU/flCP/ushqR+kISkIdIg4uR5ZDXGudCLi73R1E4Qa+jQHCZASAkpXv8YiT/BM7RffVcHd/JOSDor7xLwqzGqqVD6WgJO2/CM9U2Y92g82W5dNRGbDEzjCz5uJGa+q6aA/dqrBhAXsFLdA0+t6fD/DbP+VnQPL5MJ7QRWJ2GHlGVNUbSNEirbyUHByVE9Xqk6Zadfefvbqkm3e59UCaX0zATlfP123uuihxN5g8QyNDP+7Nb25lTidBJdGnc4XD6ZUBoHLygdSdkKwvRCpwo4fK5uGSHdDCJGTUUHqBElZKzzqq0e6rJSUsq3+1baarcucPUpGjXp74GgZz9ym3kP+751MoomCp02HfNtR6AQqBFQKbZjYt/JaaXyY6Y76Md6GarXQcagaDOdJsIrF7D6MXLA/7Nhj8qGn7i6+4jEUZSQUjheAxsHzhPWaoEfl7vLSBYA2MB0j6Zy2GwVPQ3D41r3mgzUf9XU3nWaglW9OYrjzqa+OOtu6cZJVWvptL11+Z6ScMNexodiMP7OhqSclw3KHxoIRbgf6dmGbmY/JHOsb9oPcM/38pN5svjlhs0Rzr/2hBOJfupi0hMwvYEx6cwGOpUhPY/L0ilsBLiYkRqHMkxRxfJO3cdDjPeQFeT2RfhsdszFr56/n9PhNPaRvG04i2BwQ3ZqqZ3cqss25FdGIRVafjiIsQ7ergncFsJu/foXJMiXXwNTc7pQdOw+Njt8R02oyysN+Sa5Zs3kOTDPyIUKcCYW/7JTC+BE/Hfj50KZxSPdFq/ypjwcRPXsM8d2MpkM/2VOOE6mBlSdMNpEk1pJR+uDGOROIuVo5Tdy/Wij0DdsBuqr7ypNwva50AGEL/B8ruaXt30qqX9L4S+bwn+x5fX42rnATUiMs7TcxoPkD9khhuy9ANlXBzy+2sf5ezVhq22EMaC1W1Y6VlgLGNxtZyNJte0KLBZR0gvN3dyLFidq1WgAII5RjqhEBy0leYgbsqfzv0bPUAzIh6xLzJMOJt1+E2vWZStsq9EQtDWWsbCra7ugFUURl9l99lQYmQMK7dQimCcnPMrgSyqCYCD1LaXAQSBKwEnrpM3EDvr4b1g1XDDuungVKe5ASv0/9CnVAHrdRt+qS8lZDXS6OpQt4Dgg4DXVud+Fs4nbRxIGH0c7+cMTkUG/QOYbUT5d6UYbqUsnP5H+1yTq44UolYXAapjXWoFt3HgPuKyzxnC69FcgAd+6eQk5UiCZbiyVDU7+IpLFjKFu+HIZu6gyWsz2xJ8G72of2m41z6T06+jUfGplbzIHUotufEFkeN7ZdapSSqfQCCI9kKECLdvCSmCq67mAu2D/n/v1VgUsjtlCgGAWjRYJErSEi3282u94AdVwFsp19i7auYSFbLsu84BeYkKCH+Svwal8iG+UQ+ArdYc3tcvGeItQS9KwRuYhLnO2VZ2rzvgfuSzt79XfzLTa5gyItinRmR2jXS2fJaYzIB5HJMgNiAtBJ5YuYHK/EOxGh5ZNZu2D2Yn937m/ZlNiKDmztpxSLaPIpqmdPMxP3WJaouP8cCCVML7cXS/wHZYGhvV3/A9oNR3Eh5hszOm5L3p4cxqICnUMlUKWZ9fAyWYz/bcShERhj4=
Variant 4
DifficultyLevel
556
Question
At a pool supply store, 10 kilograms of salt costs $4.00 and 30 kilograms of the same salt costs $12.00.
Which graph could show the relationship between the amount of salt and its cost?
Worked Solution
Question Type
Multiple Choice (One Answer)
Variables
| Variable name | Variable value |
| question | At a pool supply store, 10 kilograms of salt costs $4.00 and 30 kilograms of the same salt costs $12.00.
Which graph could show the relationship between the amount of salt and its cost?
|
| workedSolution | |
| correctAnswer | sm_img https://teacher.smartermaths.com.au/wp-content/uploads/2022/08/Algebra_20325_v4A_b.svg 230 indent vpad |
Answers
U2FsdGVkX1+VGEQw43Ru4dclL5B2nu5IaA3YBE3vQ0PdG8lnYZmNc1TPMl0N0PcKtd9hAMd3WQtjdJBl17VFrs2Tuv1pASi6OuLg0kjWIcWtXfAJb21zHUsPhdcbieSmPR5cU/bwAdppwmvtiswPQuWefmp0hwhKTbzRf+Cv/C9Hmom60yU6XCCYX4JXqpsPLfQrN20Bnr0x8QGRlph2Im/grszBTcROnfBSNqw5J8T/gBEkuPScishCg5UJ04+Yn0KRmTWt0zibx9BG982K4T993z9ujfS0rKr7XtO6orZtZTDdEqHSnRQi8SGLiiOg59DN4YLsHFTEmVOBgzmaPO+fJo1Pn553c2iqzz6kTQie+M3ncPvi6V5/cbJmpF8dEcEYdhLX+WLedWzdDQLLVG5RjMJXZcJGC6xK4GfJo/0ENkqiEzFb3EGwUmMbbmJaqqDPHwLFkG378c7cmwe4eceRiVIvaoaXgQoDSfpv2O4HtYtDacARZWEsyDalWnhNR7r7xslugHZ5XkUANLMn20mH3pZ0sUKY5c5OeeI+XgAWolYftK21U0YyFXqML0XlauNDbimNJBaW9sntHod8k2gVInKtbbH4wpNZSk1d4RunCIqZNUvYbhLrvh8zdwiUOvRqk3Jfi7mUkrm5RTEaRStezjK6tSlvNHQb+RJ++YRAKvtyDnvxg4PxK34uo+nPKM4MR96EAT9gigAqghRZDnLSlg3BPJN4tU1Dk07JcRp8ozkjj1HgpsVJPbfJ/QiRJ5gejoTWLfvWa1caNjUaZ9dbXOuOmBC1q4x0fllB8TeUB/yqH3D+cGKkwIdU3RUsEgy6xMkqZJczKp91Q2DV76cPaFB7+7iV5vaxQruQ8Tm8cylhcKmEozrN6+0mOWLyHkJQGoBUWrV7m92wkQiqVmPCj2oBnaTTzR7xVLGOUoocg/uDDV8DrJ32c+2RTCPTIjqARjD3AAzkf/Ad2wdGoAd6L450ixPwytT/TjpRVkY0bV2IppU0CSBVikTHG3FKuWTxl+s4deW8vuIULjFYUtBIAhu6H8kLIGI3CSMfalcRkAhaKHujlJAVisySDvSywEDSjwa4+5GeMVl/YPm4suktbPH474MtXqPNCCoxCMZ7+WlrT9i5tKgeaQKaV6czzAzbGAzyCpQ9EXasBvQgQBn1ThJhW6sxGVYaXE6dnrsaRrS4TFiPVkur/LYN/kxzuJCW3U4NXzAI32g+V5hK3jxetf0YLD5sUKnmPrqmGbttQXXkWSEBDeR9C76jizq+GMJAYUrg2geto69BrsR1AH/YfC+ShoeIHkUHeWTcp7MsogOHkhIP37i04xLSV74s/lnTYwEC96nw1LF8V+XJldtmW5Tt19vDE3f3mm20Zsjh+P1ZPUVLZ3UIoQLxLZ+Za2+I1fLKKyGwAf3DeFmD0T7algcTOP+U13iSO5WKARvIBklm4Abkd/Nwy5Bj6EjX+cMOEJm4G5Q/LE9rvXVkI7ivwdUPVzpS8rmJrdKmOrcHY/rgNmz2jPMhPkYqYUx/vmPUaKsorr1XTICbOW83dlQFpte9i4lm+IAyRm3LRtnZCZTcy/qB6IYNCqf1r0lscKgD+1E+hcXFyVv4+0UEmJ/9wfiqypXxIK7iSnnT6J7mn/SICQfgWwWDq2IrXaimncZUTJJUpmHEsQBDI3HFdjhvtk6Zsv7/TE69ggpNKcCWxsV6G0ZTiN0Q6nIyKGQStNwTS2P72NePkAp+wnaJebeNkndHSIruWjVvNcFty8FzykgYura3o99dXPeDOFcjraEw3YexTyn7wuDFbk15tdrt7zV1bbCOVBuKm1Q2xGb4IFhRb2CazdiNGNHXsClLS4fyrrzHTy7YiFXLlCjZFWUCHpJxuSso4GOl6ZQhrIc=
Variant 5
DifficultyLevel
560
Question
At a pool supply store, 20 kilograms of salt costs $7.50 and 40 kilograms of the same salt costs $15.00.
Which graph could show the relationship between the amount of salt and its cost?
Worked Solution
Question Type
Multiple Choice (One Answer)
Variables
| Variable name | Variable value |
| question | At a pool supply store, 20 kilograms of salt costs $7.50 and 40 kilograms of the same salt costs $15.00.
Which graph could show the relationship between the amount of salt and its cost?
|
| workedSolution | |
| correctAnswer | sm_img https://teacher.smartermaths.com.au/wp-content/uploads/2022/08/Algebra_20325_v5A_c.svg 230 indent vpad |
Answers