Number and Algebra, NAP_20323
Question
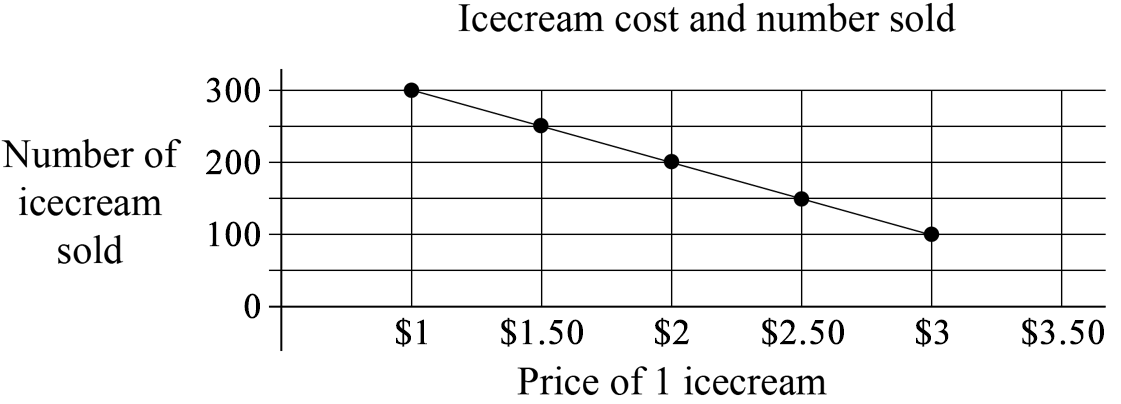
Jeremy sold ice creams out of his ice cream truck.
He drew the graph below to show how the number of ice creams he sells in a week is related to their price.
Which statement best describes the graph?
Worked Solution
U2FsdGVkX1+z+kL8bQx9Ne7NHOhjAseJOPc2AijTHGIAOMu5UsaQM+qFeil1Fa0HcXIhoqM85AOQaZL5LBRV9qE1FK+bgmihUIeNFI7zqOS3RmrHQmMHDjDr/ymkosPGyRb+9IJ/joi8wjlQWWDDFJnx2eIiv7ZuxQsPAyzpMe2w5XeabHyWR1RHGvV9p43IRMU6zdAAFILHIOQX1u3rz3MZeyDeFKXLyvuQP1M+S7GUlxU5utbnE5a3TVUVnvOsiLHv8kB5h/CrtcaPSM3QV2D7Pfpf1CiucjmOHyAJC+XOhiZ2jJG6KoISa/CdmoJONLfXb3l9IoO1xrUR2gU9vymAJVgT6SHy9+2Rue7GmT2BaT11KNsWomM9JWubUo5oxn8kuo5KQYcFNhVimReFFZxWWt5mhCkmTX0IcZfbdl/7JqP3iP6JbPTXCdyYSzC3CYf+nqV9XuycLh5uKPqR+kguyvXn5orIHJagXWeslY2oNu7VRsbFDOqMT2raC0CdLQfSVkZyU/WMFqHm8Ov0eywj0WcAgR/SySy7SzvsxH8NIwr3voecJQsBgGOml3w03Na7LUKj8Tp6Lx4OJggzcyw3koSn/LZN3NiryzS29yHQtAvEDYK+Ky5Z6j/cIWp96ZI6ceDZnv1yIUWW6QzIcUnNI4w2zgX9/DnAH/B3FobkJ+911ZoOLZT3G5AFDpCbGRLXj7rG56jXgiDPlkjvqATM+gaEs6pjN/Ah3lZsnlNaGP418kF3VAkAjZK+gKhEN3FLqI8+BW6ZlSuxwbj+5JJ4fwSaz46mOznonhvtur1uoTiXFrHVEPPRepyr4a9axMYnWIiHNZ6ysPPxYaqEpR1llNdwW3EEA3MBgAgz8tlyqT/dd5n/WJziqPgqSqgmWuJSz+dxkAMNprL+ISAD5ED0dvJqZR3RmD3wVUrgl3KUkBK5BcQxu+4xfewIx+Z5mKcU4VoppNkh6lEwUCpNaN1PCE6fbliI9QEAw3gauKldQL2t9zP4VENtuRmSwrZXI4fe9lqwunRPzZSnU7NwDJg4Alhd6ga3TrS+g4usjdp6ZndkSROW3dOMEo0WUW0RZEht9fXtr3U1kGh1ZhrKYPhxHrkrCncAn3+6nkocHouOte8Z+JtfL1XCIsc5BDR8O/J6lYgk+pmjk/uvCPbVtsRRRGeT6LQpPnwXi7R6IuGL+IoTUBvt/zBh/+iW1uL3FQXPb+lgO1p0NFoEagzpY1XuoRWRVISd1b+2eKI+t+l49SREjCECuqS/Ax/y+ZysujTRulDoWpVsuXP97wz3BeO+1cq5Tz/KR1NVb9BwgHxgeI/T8tYMRfRfpnuF//NrxKcWkoNOr804ESdinKlF5ih3SUYITIcC+QGdLIpqmfs/uuR0yiyPcQ5pmT8xjQe87Bp2mvP+y7Whn4/L35iQ+uVhrEKRMQYU7IjcaPLT1B09wdxEHk+rfUfhxqX/7awinnABE6LxDmo1oQ2FoWNJMZv9sv7by71dOd6s5MB/km38A7DeK9qo54LvkgvAZ7GGM+bQZ3kauqMuT0K8c6MzRq0vKxeiqIw/66bFQHTDRaQKDlmWybuzWpSi3MHWGIcwykbAMDTfi6hKI9AJHRQaNtggUi5pWH43q34AJNDao9DQvl16GIxSASr+iV+5ItbvwpFKA/0raQtNYgy7gNLgY6eZn5WgDjb22SU+Bhokb/+QFTJK8RujFBU9o6twTazewx3DsosIfJmbevDzoPQGkg==
Variant 0
DifficultyLevel
498
Question
Jeremy sold ice creams out of his ice cream truck.
He drew the graph below to show how the number of ice creams he sells in a week is related to their price.
Which statement best describes the graph?
Worked Solution
As the ice cream price goes up, the number sold goes down.
Question Type
Multiple Choice (One Answer)
Variables
| Variable name | Variable value |
| correctAnswer | As the ice cream price goes up, the number sold goes down. |
Answers
| Is Correct? | Answer |
| ✓ | As the ice cream price goes up, the number sold goes down. |
| x | As the ice cream price goes up, the number sold goes up. |
| x | As the ice cream price goes down, the number sold goes down. |
| x | As the ice cream price goes down, the number sold stays the same. |